DAS Analyser |
|
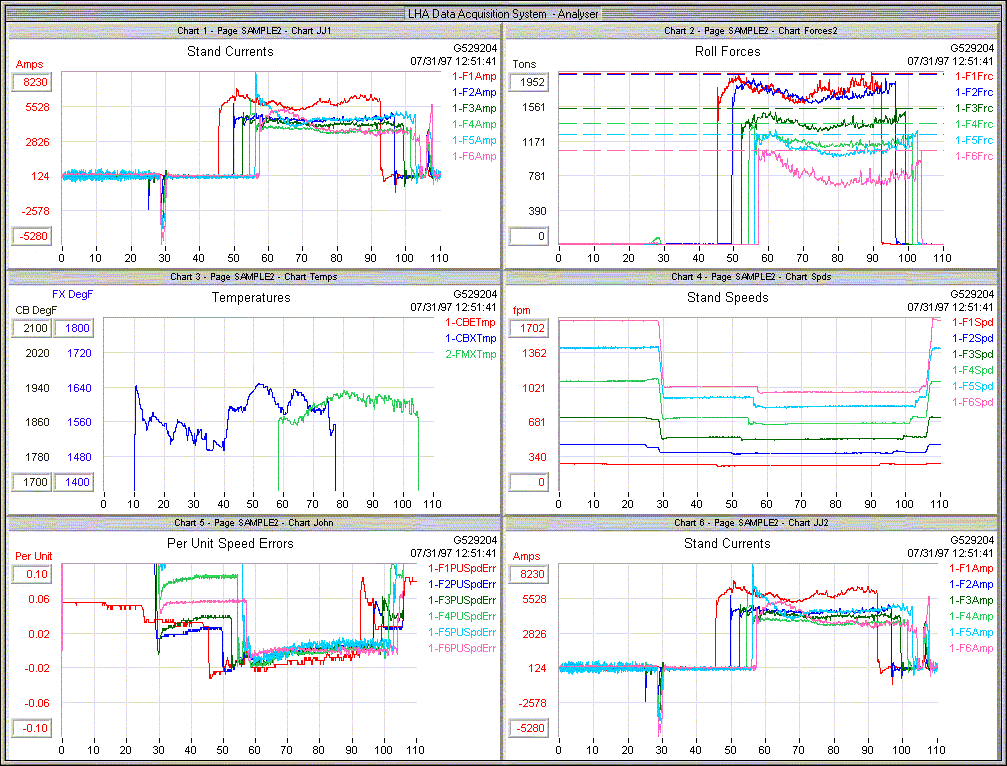
The DAS Analyser is a Windows PC application with comprehensive graphing and analysis capability for trend data. Time-based and X-Y charts can be combined in a wide variety of pre-defined screen layouts allowing you to see your key data however you require. Multiple screen layouts can be saved easily and scrolled through with a key click. 
This screen shot shows a common summary layout with 6 charts tiled at low resolution. Built-in options allow quick tiling by halves, quarters and sixths of the DAS Analyser main window (and combinations there-of). Both individual charts and entire screens can be printed or captured to the Windows clipboard for use in reports or presentations. Printed charts print at printer resolution. Individual charts display up to 12 signals on up to 4 Y-axes. X-axis values can be either absolute or fraction of maximum (allowing the user to plot versus per-unit rolled length). A formula builder eases the definition of arbitrarily complex calculated signals. The DAS Analyser can extract data from archived data to text files compatible with MS Excel and other spreadsheets. Subsets of the archived data can be selected for extraction. Excel spreadsheet templates and a set of macros are included. The comprehensive online manual, in HTML Help format, includes context-sensitive help for all windows. |